Different threshold_position options#
Imports#
[1]:
%matplotlib inline
import matplotlib.pyplot as plt
import numpy as np
import tobac
import xarray as xr
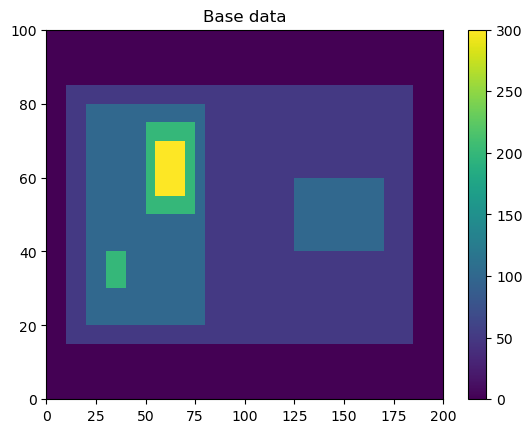
Generate Feature Data#
Here, we will generate some simple feature data where the features that we want to detect are higher values than the surrounding (0).
[2]:
# Dimensions here are time, y, x.
input_field_arr = np.zeros((1, 100, 200))
input_field_arr[0, 15:85, 10:185] = 50
input_field_arr[0, 20:80, 20:80] = 100
input_field_arr[0, 40:60, 125:170] = 100
input_field_arr[0, 30:40, 30:40] = 200
input_field_arr[0, 50:75, 50:75] = 200
input_field_arr[0, 55:70, 55:70] = 300

plt.pcolormesh(input_field_arr[0])
plt.colorbar()
plt.title("Base data")
plt.show()
[3]:
# We now need to generate an xarray DataArray out of this dataset to run tobac feature detection.
input_field_da = xr.DataArray(
    input_field_arr,
    dims=["time", "Y", "X"],
    coords={"time": [np.datetime64("2019-01-01T00:00:00")]},
)
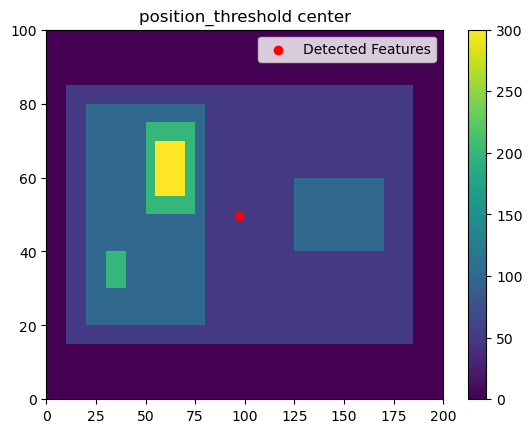
position_threshold='center'#
This option will choose the arithmetic center of the area above the threshold. This is typically not recommended for most data.
[4]:
thresholds = [
    50,
]
position_threshold = "center"
single_threshold_features = tobac.feature_detection_multithreshold(
    field_in=input_field_da,
    dxy=1000,
    threshold=thresholds,
    target="maximum",
    position_threshold=position_threshold,
)
plt.pcolormesh(input_field_arr[0])
plt.colorbar()
# Plot all features detected
plt.scatter(
    x=single_threshold_features["hdim_2"].values,
    y=single_threshold_features["hdim_1"].values,
    color="r",
    label="Detected Features",
)
plt.legend()
plt.title("position_threshold " + position_threshold)
plt.show()
position_threshold='extreme'#
This option will choose the most extreme point of our data. For target='maximum', this will be the largest value in the feature area.
[5]:
thresholds = [
    50,
]
position_threshold = "extreme"
single_threshold_features = tobac.feature_detection_multithreshold(
    field_in=input_field_da,
    dxy=1000,
    threshold=thresholds,
    target="maximum",
    position_threshold=position_threshold,
)
plt.pcolormesh(input_field_arr[0])
plt.colorbar()
# Plot all features detected
plt.scatter(
    x=single_threshold_features["hdim_2"].values,
    y=single_threshold_features["hdim_1"].values,
    color="r",
    label="Detected Features",
)
plt.legend()
plt.title("position_threshold " + position_threshold)
plt.show()

position_threshold='weighted_diff'#
This option will choose the center of the region weighted by the distance from the threshold value.
[6]:
thresholds = [
    50,
]
position_threshold = "weighted_diff"
single_threshold_features = tobac.feature_detection_multithreshold(
    field_in=input_field_da,
    dxy=1000,
    threshold=thresholds,
    target="maximum",
    position_threshold=position_threshold,
)
plt.pcolormesh(input_field_arr[0])
plt.colorbar()
# Plot all features detected
plt.scatter(
    x=single_threshold_features["hdim_2"].values,
    y=single_threshold_features["hdim_1"].values,
    color="r",
    label="Detected Features",
)
plt.legend()
plt.title("position_threshold " + position_threshold)
plt.show()

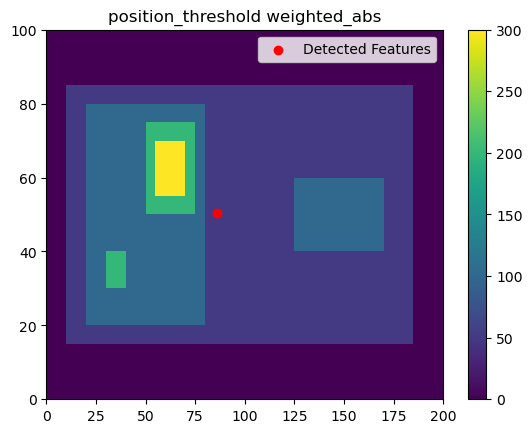
position_threshold='weighted_abs'#
This option will choose the center of the region weighted by the absolute values of the field.
[7]:
thresholds = [
    50,
]
position_threshold = "weighted_abs"
single_threshold_features = tobac.feature_detection_multithreshold(
    field_in=input_field_da,
    dxy=1000,
    threshold=thresholds,
    target="maximum",
    position_threshold=position_threshold,
)
plt.pcolormesh(input_field_arr[0])
plt.colorbar()
# Plot all features detected
plt.scatter(
    x=single_threshold_features["hdim_2"].values,
    y=single_threshold_features["hdim_1"].values,
    color="r",
    label="Detected Features",
)
plt.legend()
plt.title("position_threshold " + position_threshold)
plt.show()
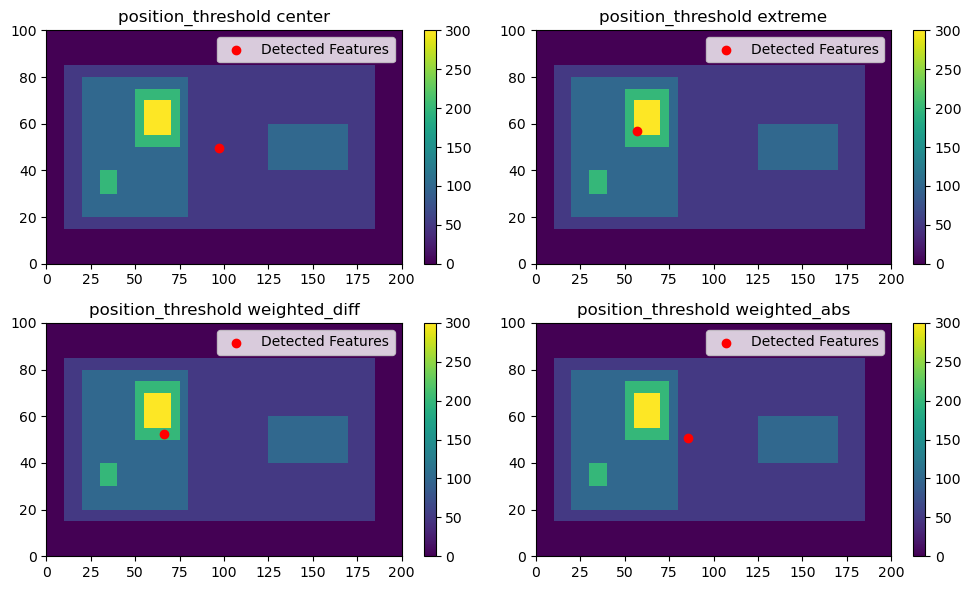
All four methods together#
[8]:
thresholds = [
    50,
]
fig, axarr = plt.subplots(2, 2, figsize=(10, 6))
testing_thresholds = ["center", "extreme", "weighted_diff", "weighted_abs"]
for position_threshold, ax in zip(testing_thresholds, axarr.flatten()):
    single_threshold_features = tobac.feature_detection_multithreshold(
        field_in=input_field_da,
        dxy=1000,
        threshold=thresholds,
        target="maximum",
        position_threshold=position_threshold,
    )
    color_mesh = ax.pcolormesh(input_field_arr[0])
    plt.colorbar(color_mesh, ax=ax)
    # Plot all features detected
    ax.scatter(
        x=single_threshold_features["hdim_2"].values,
        y=single_threshold_features["hdim_1"].values,
        color="r",
        label="Detected Features",
    )
    ax.legend()
    ax.set_title("position_threshold " + position_threshold)
plt.tight_layout()
plt.show()