How n_min_threshold changes what features are detected
Imports
[1]:
%matplotlib inline
import matplotlib.pyplot as plt
import numpy as np
import tobac
import xarray as xr
Generate Feature Data
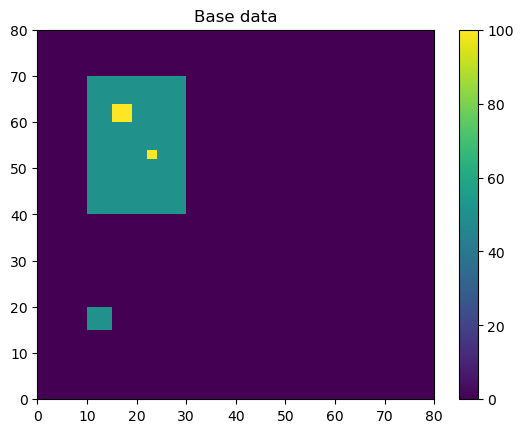
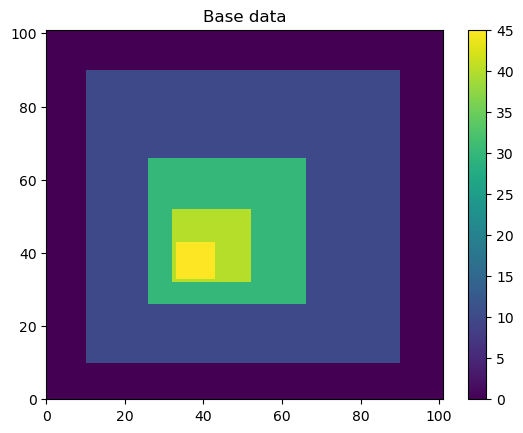
Here, we will generate some simple feature data with a variety of features, large and small.
[2]:
# Dimensions here are time, y, x.
input_field_arr = np.zeros((1, 80, 80))
# small 5x5 feature, area of 25 points
input_field_arr[0, 15:20, 10:15] = 50
# larger 30x30 feature, area of 900
input_field_arr[0, 40:70, 10:30] = 50
# small 2x2 feature within larger 30x30 feature, area of 4 points
input_field_arr[0, 52:54, 22:24] = 100
# small 4x4 feature within larger 30x30 feature, area of 16 points
input_field_arr[0, 60:64, 15:19] = 100

plt.pcolormesh(input_field_arr[0])
plt.colorbar()
plt.title("Base data")
plt.show()
[3]:
# We now need to generate an Iris DataCube out of this dataset to run tobac feature detection.
# One can use xarray to generate a DataArray and then convert it to Iris, as done here.
input_field_iris = xr.DataArray(
    input_field_arr,
    dims=["time", "Y", "X"],
    coords={"time": [np.datetime64("2019-01-01T00:00:00")]},
).to_iris()
# Version 2.0 of tobac (currently in development) will allow the use of xarray directly with tobac.
/var/folders/40/kfr98p0j7n30fjp2n4ljjqbh0000gr/T/ipykernel_51434/1759418141.py:3: UserWarning: Converting non-nanosecond precision datetime values to nanosecond precision. This behavior can eventually be relaxed in xarray, as it is an artifact from pandas which is now beginning to support non-nanosecond precision values. This warning is caused by passing non-nanosecond np.datetime64 or np.timedelta64 values to the DataArray or Variable constructor; it can be silenced by converting the values to nanosecond precision ahead of time.
  input_field_iris = xr.DataArray(
No n_min_threshold
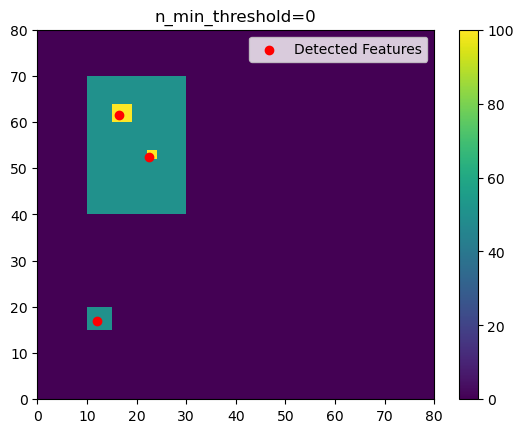
If we keep n_min_threshold at the default value of 0, all three features will be detected with the appropriate thresholds used.
[4]:
thresholds = [50, 100]
# Using 'center' here outputs the feature location as the arithmetic center of the detected feature.
# All filtering is off in this example, although that is not usually recommended.
single_threshold_features = tobac.feature_detection_multithreshold(
    field_in=input_field_iris,
    dxy=1000,
    threshold=thresholds,
    target="maximum",
    position_threshold="center",
    sigma_threshold=0,
)
plt.pcolormesh(input_field_arr[0])
plt.colorbar()
# Plot all features detected
plt.scatter(
    x=single_threshold_features["hdim_2"].values,
    y=single_threshold_features["hdim_1"].values,
    color="r",
    label="Detected Features",
)
plt.legend()
plt.title("n_min_threshold=0")
plt.show()
Increasing n_min_threshold
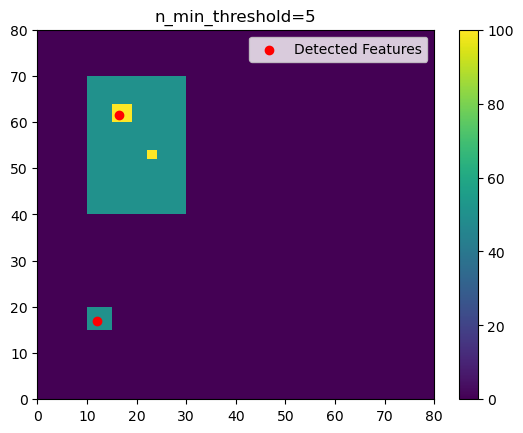
As we increase n_min_threshold, fewer of these separate features are detected. In this example, if we set n_min_threshold to 5, the smallest detected feature goes away.
[5]:
thresholds = [50, 100]
n_min_threshold = 5
# Using 'center' here outputs the feature location as the arithmetic center of the detected feature.
# All filtering is off in this example, although that is not usually recommended.
single_threshold_features = tobac.feature_detection_multithreshold(
    field_in=input_field_iris,
    dxy=1000,
    threshold=thresholds,
    target="maximum",
    position_threshold="center",
    sigma_threshold=0,
    n_min_threshold=n_min_threshold,
)
plt.pcolormesh(input_field_arr[0])
plt.colorbar()
# Plot all features detected
plt.scatter(
    x=single_threshold_features["hdim_2"].values,
    y=single_threshold_features["hdim_1"].values,
    color="r",
    label="Detected Features",
)
plt.legend()
plt.title("n_min_threshold={0}".format(n_min_threshold))
plt.show()
If we increase n_min_threshold to 20, only the large 50-valued feature is detected, rather than the two higher-valued squares.
[6]:
thresholds = [50, 100]
n_min_threshold = 20
# Using 'center' here outputs the feature location as the arithmetic center of the detected feature.
# All filtering is off in this example, although that is not usually recommended.
single_threshold_features = tobac.feature_detection_multithreshold(
    field_in=input_field_iris,
    dxy=1000,
    threshold=thresholds,
    target="maximum",
    position_threshold="center",
    sigma_threshold=0,
    n_min_threshold=n_min_threshold,
)
plt.pcolormesh(input_field_arr[0])
plt.colorbar()
# Plot all features detected
plt.scatter(
    x=single_threshold_features["hdim_2"].values,
    y=single_threshold_features["hdim_1"].values,
    color="r",
    label="Detected Features",
)
plt.legend()
plt.title("n_min_threshold={0}".format(n_min_threshold))
plt.show()

If we set n_min_threshold to 100, only the largest feature is detected.
[7]:
thresholds = [50, 100]
n_min_threshold = 100
# Using 'center' here outputs the feature location as the arithmetic center of the detected feature.
# All filtering is off in this example, although that is not usually recommended.
single_threshold_features = tobac.feature_detection_multithreshold(
    field_in=input_field_iris,
    dxy=1000,
    threshold=thresholds,
    target="maximum",
    position_threshold="center",
    sigma_threshold=0,
    n_min_threshold=n_min_threshold,
)
plt.pcolormesh(input_field_arr[0])
plt.colorbar()
# Plot all features detected
plt.scatter(
    x=single_threshold_features["hdim_2"].values,
    y=single_threshold_features["hdim_1"].values,
    color="r",
    label="Detected Features",
)
plt.legend()
plt.title("n_min_threshold={0}".format(n_min_threshold))
plt.show()

Different n_min_threshold for different threshold values
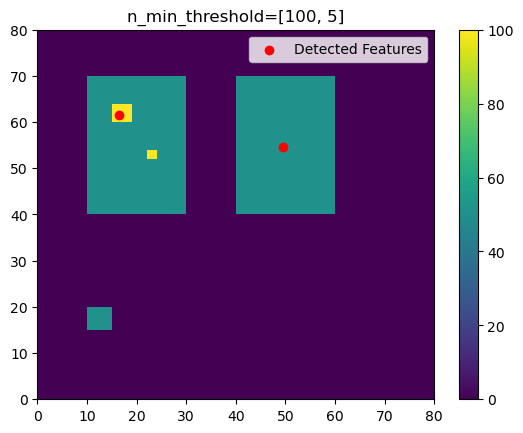
Another option is to use different n_min_threshold values for different threshold values. This can be practical because extreme values are usually not as widespread as less extreme values (think for example of the rain rates in a convective system).
If we set n_min_threshold to 100 for the lower threshold and to 5 for the higher threshold, only the larger 50-valued features are detected, but at the same time we make sure that the smaller areas with the 100-valued features are still detected:
[8]:
thresholds = [50, 100]

# defining multiple n_min_threshold:
n_min_threshold = [100, 5]
# alternatively, these could be given as a dictionary: n_min_threshold = {50:100,100: 5}

# let's add another larger 30x30 feature, area of 900 to make the example more clear
input_field_iris.data[0, 40:70, 40:60] = 50

# Using 'center' here outputs the feature location as the arithmetic center of the detected feature.
# All filtering is off in this example, although that is not usually recommended.
single_threshold_features = tobac.feature_detection_multithreshold(
    field_in=input_field_iris,
    dxy=1000,
    threshold=thresholds,
    target="maximum",
    position_threshold="center",
    sigma_threshold=0,
    n_min_threshold=n_min_threshold,
)


plt.pcolormesh(input_field_iris.data[0])
plt.colorbar()
# Plot all features detected
plt.scatter(
    x=single_threshold_features["hdim_2"].values,
    y=single_threshold_features["hdim_1"].values,
    color="r",
    label="Detected Features",
)
plt.legend()
plt.title("n_min_threshold={0}".format(n_min_threshold))
plt.show()
Strict Thresholding (strict_thresholding)
Sometimes it may be desirable to detect only features that satisfy all specified n_min_threshold thresholds. This can be achieved with the optional argument strict_thresholding=True.
[9]:
# As above, we create test data to demonstrate the effect of strict_thresholding
input_field_arr = np.zeros((1, 101, 101))

for idx, side in enumerate([40, 20, 10, 5]):
    input_field_arr[
        :,
        (50 - side - 4 * idx) : (50 + side - 4 * idx),
        (50 - side - 4 * idx) : (50 + side - 4 * idx),
    ] = (
        50 - side
    )

input_field_iris = xr.DataArray(
    input_field_arr,
    dims=["time", "Y", "X"],
    coords={"time": [np.datetime64("2019-01-01T00:00:00")]},
).to_iris()

plt.pcolormesh(input_field_arr[0])
plt.colorbar()
plt.title("Base data")
plt.show()
/var/folders/40/kfr98p0j7n30fjp2n4ljjqbh0000gr/T/ipykernel_51434/418987827.py:13: UserWarning: Converting non-nanosecond precision datetime values to nanosecond precision. This behavior can eventually be relaxed in xarray, as it is an artifact from pandas which is now beginning to support non-nanosecond precision values. This warning is caused by passing non-nanosecond np.datetime64 or np.timedelta64 values to the DataArray or Variable constructor; it can be silenced by converting the values to nanosecond precision ahead of time.
  input_field_iris = xr.DataArray(
[10]:
thresholds = [8, 29, 39, 44]

n_min_thresholds = [79**2, input_field_arr.size, 8**2, 3**2]

f = plt.figure(figsize=(10, 5))

# perform feature detection with and without strict thresholding and display the results side by side

for idx, strict in enumerate((False, True)):
    features_demo = tobac.feature_detection_multithreshold(
        input_field_iris,
        dxy=1000,
        threshold=thresholds,
        n_min_threshold=n_min_thresholds,
        strict_thresholding=strict,
    )
    ax = f.add_subplot(121 + idx)
    ax.pcolormesh(input_field_iris.data[0])
    ax.set_title(f"strict_thresholding={strict}")
    ax.scatter(
        x=features_demo["hdim_2"].values,
        y=features_demo["hdim_1"].values,
        marker="x",
        color="r",
        label="Detected Features",
    )
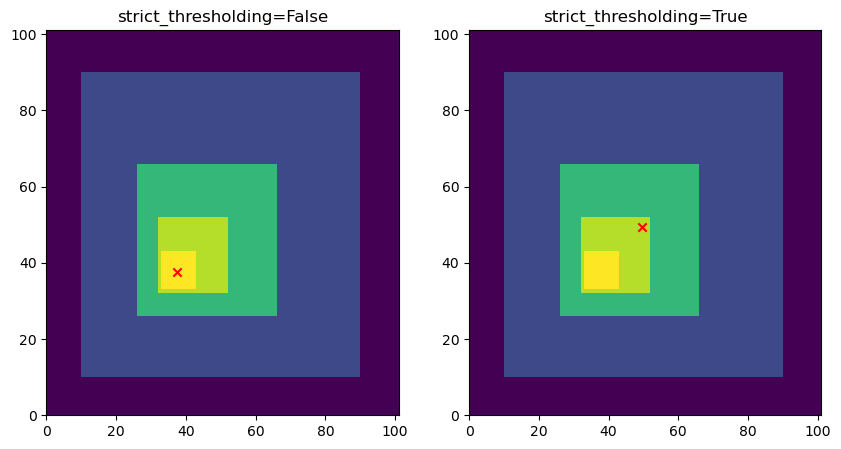
The effect of strict_thresholding can be observed in the plot above: Since the second n_min_threshold is not reached, no further features can be detected at higher threshold values. In the case of non strict thresholding, the feature with the highest value is still detected even though a previous n_min_threshold was not reached.