Methods and Parameters for Segmentation
This notebook explores the segmentation function of tobac and its parameters:
We start with the usual imports:
[1]:
import matplotlib.pyplot as plt
import numpy as np
import xarray as xr

%matplotlib inline

import seaborn as sns

sns.set_context("talk")

import warnings

warnings.filterwarnings("ignore")
[2]:
import tobac
import tobac.testing
Required Inputs
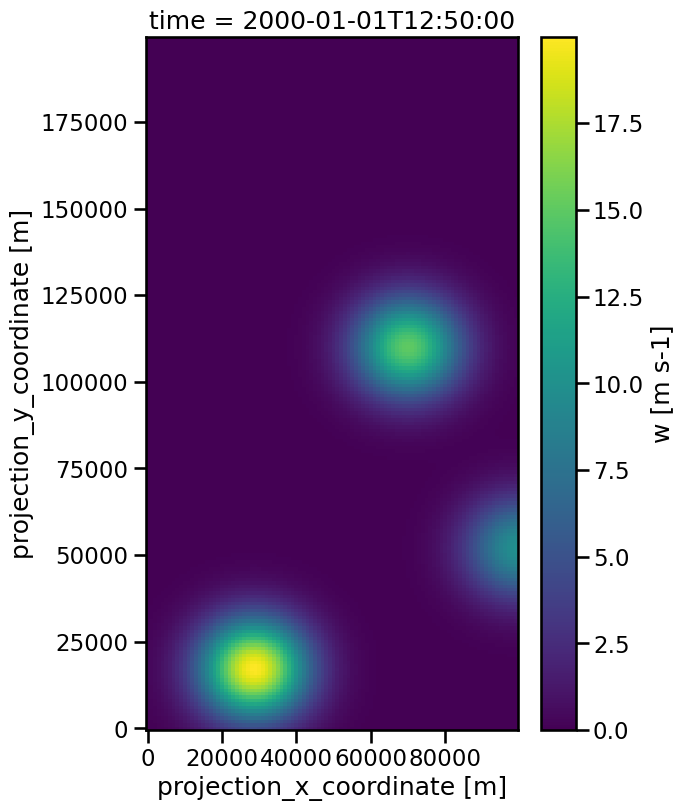
To perform a segmentation we need a dataset with already detected features. Therefore, we take advantage of the testing.make_sample_data_2D_3blobs_inv()-utility and detect features with different thresholds:
[3]:
data = tobac.testing.make_sample_data_2D_3blobs_inv(data_type="xarray")
dxy, dt = tobac.utils.get_spacings(data)

plt.figure(figsize=(6, 9))
data.isel(time=50).plot(x="x", y="y")
[3]:
<matplotlib.collections.QuadMesh at 0x13d3275d0>
[4]:
%%capture
thresholds = [9, 14, 17]
features = tobac.feature_detection_multithreshold(
    data, dxy, thresholds, position_threshold="weighted_abs"
)
The resulting dataset can now be used as argument for the segmentation()-function. The other required inputs are the original dataset, the spacing and a threshold.
[5]:
mask, features_mask = tobac.segmentation_2D(features, data, dxy, threshold=9)
The created segments are provided as mask, which is the first returned object of the function. The second output is the features-dataset again, but with the additional ncells-variable, which gives us the number of datapoints belonging to the feature:
[6]:
features_mask["ncells"][1]
[6]:
67.0
Notice that this number can be deviate from the num-value, because watershedding works differently from just detecting the values exceeeding the threshold. For example, for the second feature ncells contains one additional datapoint compared to the original feature detection:
[7]:
features_mask["num"][1]
[7]:
66
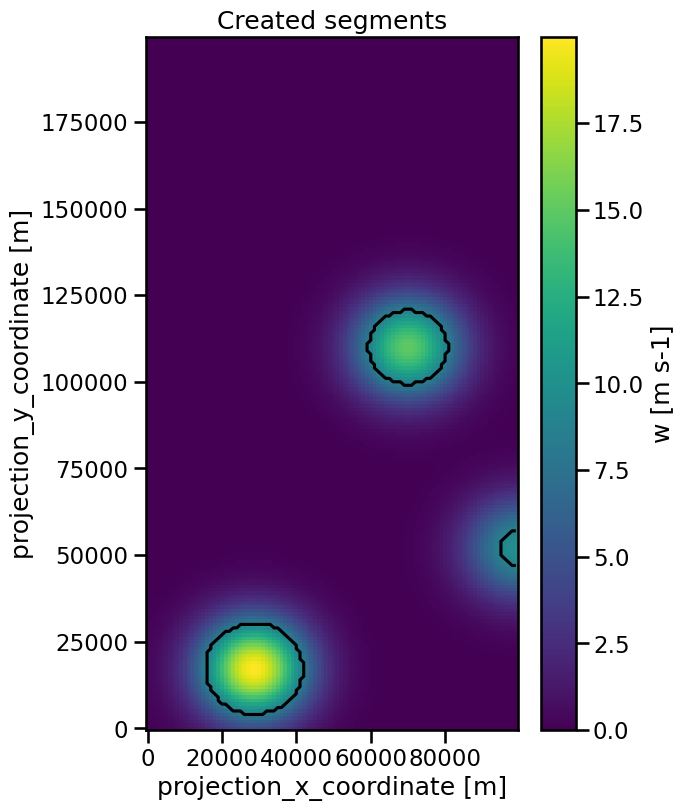
The created segments can be visualized with a contour plot of tha mask:
[8]:
plt.figure(figsize=(6, 9))
data.isel(time=50).plot(x="x", y="y")
mask.isel(time=50).plot.contour(levels=[0.5], x="x", y="y", colors="k")
plt.title("Created segments")
[8]:
Text(0.5, 1.0, 'Created segments')
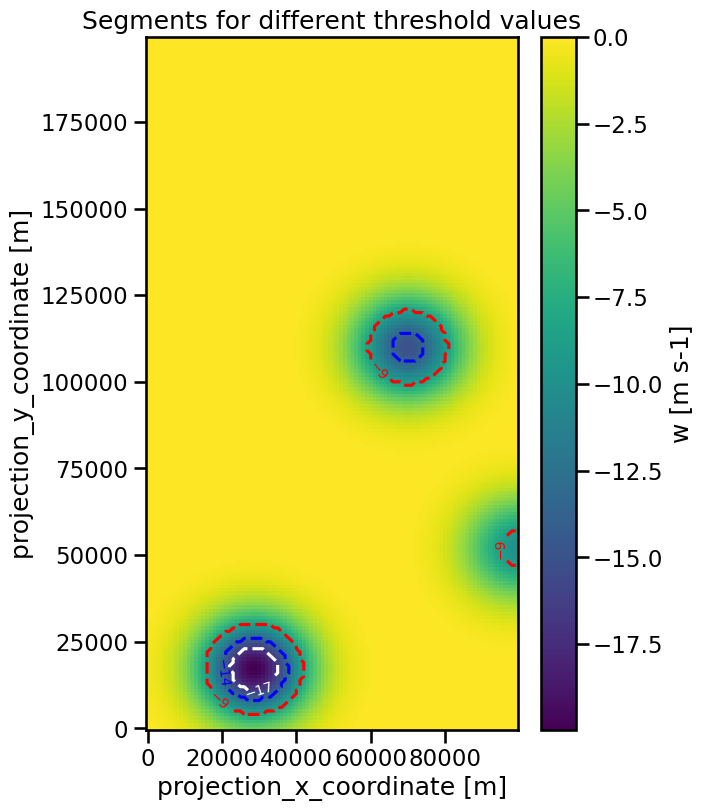
Different Thresholds
It is important to highlight that (in contrast to the feature detection), segmentation is only possible with single threshold values. Because of that, we have to call the function multiple times with different threshold values to explore the influence of this argument:
[9]:
%%capture
mask_1, features_mask_1 = tobac.segmentation_2D(features, data, dxy, threshold=9)
mask_2, features_mask_2 = tobac.segmentation_2D(features, data, dxy, threshold=14)
mask_3, features_mask_3 = tobac.segmentation_2D(features, data, dxy, threshold=17)
To visualize the segments we can use contour-plots of the masks:
[10]:
thresholds = [9, 14, 17]
masks = [mask_1, mask_2, mask_3]
colors = ["w", "r", "b"]

fig, ax = plt.subplots(ncols=1, figsize=(6, 9))
data.isel(time=50).plot(ax=ax, x="x", y="y")

for n, mask, color in zip(thresholds, masks, colors):
    contour = mask.isel(time=50).plot.contour(levels=[n], x="x", y="y", colors=color)
    ax.clabel(contour, inline=True, fontsize=10)

ax.set_title("Segments for different threshold values")
[10]:
Text(0.5, 1.0, 'Segments for different threshold values')

Obviously, a lower threshold value prodcuces a larger segment and if a feature does not exceed the value at all, no segment is associated.
Choosing Method and Target
The segmentation uses certain techniques to associate areas or volumes to each identified feature. Watershedding is the default and the only implemented option at the moment, but in future realeases the method will be selected by the method-keyword:
[11]:
%%capture
mask_1, features_mask_1 = tobac.segmentation_2D(
    features, data, dxy, threshold=9, method="watershed"
)
Analogous to the feature detection, it is also possible to apply the segmentation to minima by changing the target keyword:
[12]:
%%capture

data = -tobac.testing.make_sample_data_2D_3blobs_inv(data_type="xarray")
dxy, dt = tobac.utils.get_spacings(data)
thresholds = [-9, -14, -17]
features = tobac.feature_detection_multithreshold(
    data, dxy, thresholds, target="minimum"
)

mask_1, features_mask_1 = tobac.segmentation_2D(
    features, data, dxy, threshold=-9, target="minimum"
)
mask_2, features_mask_2 = tobac.segmentation_2D(
    features, data, dxy, threshold=-14, target="minimum"
)
mask_3, features_mask_3 = tobac.segmentation_2D(
    features, data, dxy, threshold=-17, target="minimum"
)
[13]:
masks = [mask_1, mask_2, mask_3]
colors = ["r", "b", "w"]
thresholds = [-9, -14, -17]

fig, ax = plt.subplots(ncols=1, figsize=(6, 9))
data.isel(time=50).plot(ax=ax, x="x", y="y")

for n, mask, color in zip(thresholds, masks, colors):
    contour = (
        (n * mask).isel(time=50).plot.contour(levels=[n], colors=color, x="x", y="y")
    )
    ax.clabel(contour, inline=True, fontsize=10)

ax.set_title("Segments for different threshold values")
[13]:
Text(0.5, 1.0, 'Segments for different threshold values')
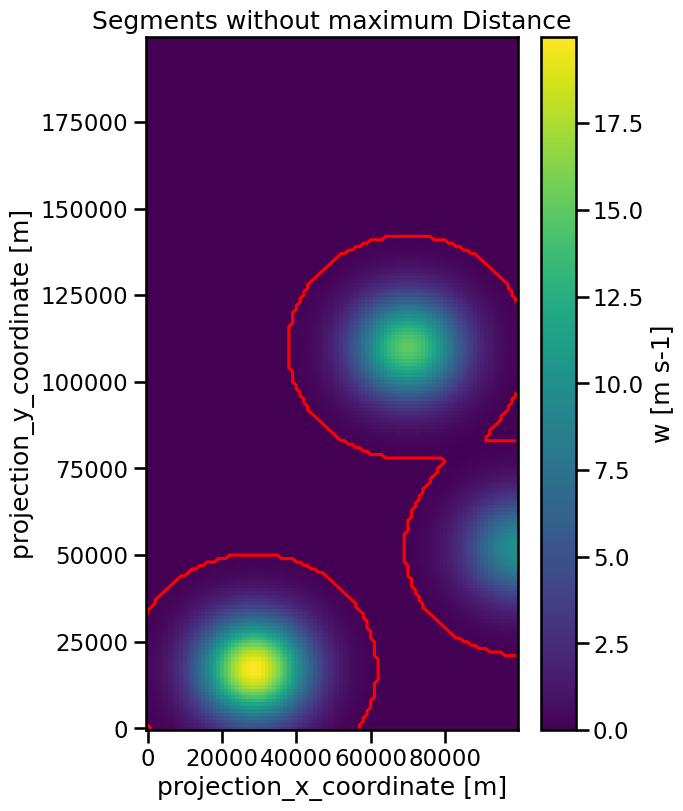
Setting a maximum Distance
Another way of determining the size of our segments is the max_distance-parameter. It defines a maximum distance the segment can have from the coordinates of feature (in meters). This enables us, for example, to ensure that the segments of different features do not touch each other when we use a very low threshold value:
[14]:
%%capture

data = tobac.testing.make_sample_data_2D_3blobs_inv(data_type="xarray")
dxy, dt = tobac.utils.get_spacings(data)
thresh = 0.1

features = tobac.feature_detection_multithreshold(data, dxy, threshold=3)
mask_0, features_0 = tobac.segmentation_2D(features, data, dxy, threshold=thresh)
As you can see the threshold value was set to a value of 0.1. The result is that the segments of the two upper features will touch:
[15]:
fig, ax = plt.subplots(figsize=(6, 9))
data.isel(time=50).plot(ax=ax, x="x", y="y")
mask_0.isel(time=50).plot.contour(levels=[0.5], ax=ax, colors="r", x="x", y="y")
ax.set_title("Segments without maximum Distance")
[15]:
Text(0.5, 1.0, 'Segments without maximum Distance')
We can prevent this from happening by using the max_distance parameter to specify a maximum distance the border of the segment can have from the feature in meter:
[16]:
%%capture

mask_1, features_mask_1 = tobac.segmentation_2D(
    features, data, dxy, threshold=thresh, max_distance=40000
)
mask_2, features_mask_2 = tobac.segmentation_2D(
    features, data, dxy, threshold=thresh, max_distance=20000
)
mask_3, features_mask_3 = tobac.segmentation_2D(
    features, data, dxy, threshold=thresh, max_distance=5000
)
[17]:
masks = [mask_1, mask_2, mask_3]
colors = ["w", "r", "k"]
distances = [4e4, 2e4, 5e3]

fig, ax = plt.subplots(ncols=1, figsize=(6, 9))
data.isel(time=50).plot(ax=ax, x="x", y="y")

for n, mask, color in zip(distances, masks, colors):
    contour = (
        (n * mask).isel(time=50).plot.contour(levels=[n], colors=color, x="x", y="y")
    )
    ax.clabel(contour, inline=True, fontsize=10)

ax.set_title("Segments for different maximum distances")
[17]:
Text(0.5, 1.0, 'Segments for different maximum distances')

Handling 3d-Data
The remaining parameters level and vertical_coord are useful only for the segemtation of 3-dimensional inputs and will be covered in the notebook for 3d-data (TBD).